Tuesday, November 16, 2010

ES Futures Charts For 11/15/10


We now have two closes below the 10-day moving average. Monday followed the usual pattern of being a below average range day following an above average range day.


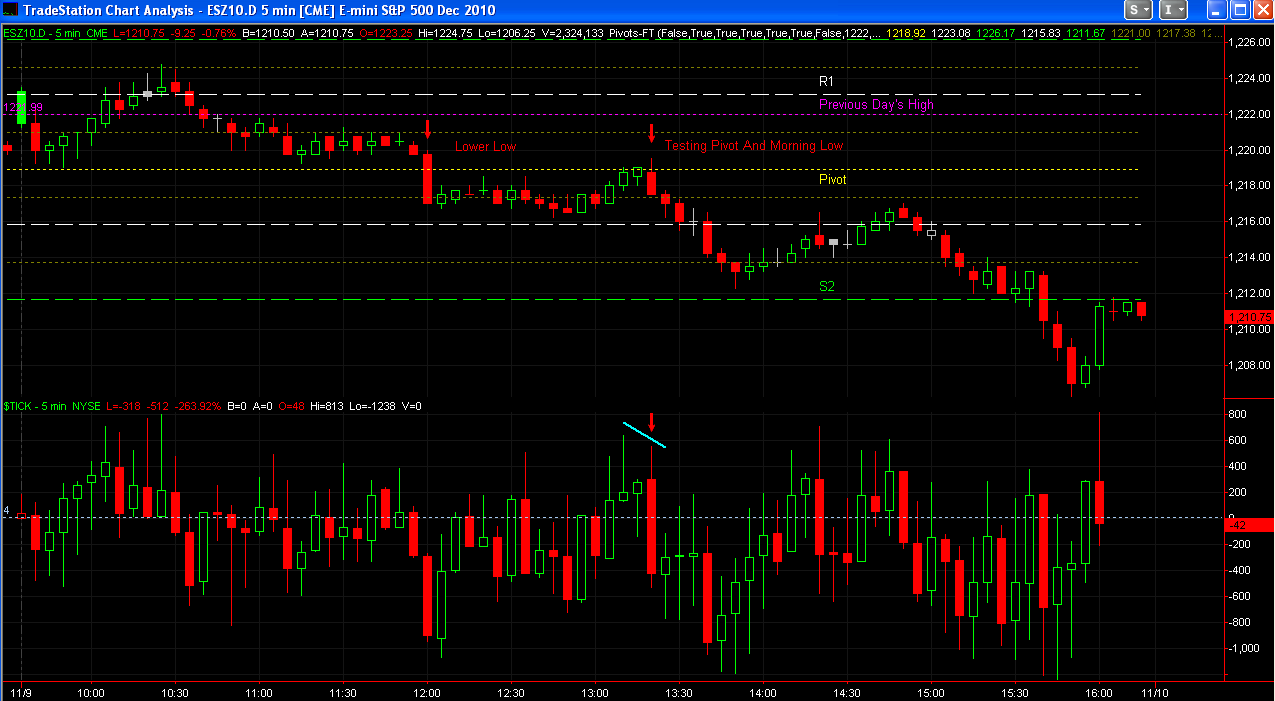
R1 held as resistance along with the 10-day moving average. The $TICK indicator showed slowing bullish momentum as the market tested R1. It finally tumbled going into the last half hour of energy market trading at 1400 ET.
Charles

Friday, November 12, 2010

China Rate Hike


The last few days, the market has been unable to close in the upper zone. So far, the lower zone is holding as support.


The China rate hike spoked the futures market overnight, but the opening of the European markets has traded the US futures back above yesterday's low. Watch tests of that low to see if it holds as support.
Charles

Wednesday, November 10, 2010

ES Futures Charts For 11/10/10


Well, the market, so far, is staying above its 10-day moving average. It has come down a little since the 1615 ET close.


Yesterday's low failed as support as the market traded down to test not only S1, but also its 10-day moving average. Those levels did hold as support as the market formed an 85 minute consolidation area around S1. The market rested below the 0930 ET open for 70 minutes to form another consolidation area after trading up about 10 points. We got another up swing to finish a 3-wave move. The second up leg was also about 10 points in length to form symmetry between the first up leg and the second. This really is nice symmetry - 85 minute consolidation - 10 point first up leg - 70 minute consolidation - 10 point second up leg.
Charles

ES Futures Charts For 11/09/10


We were due for a correction back to the 10-day moving average, and a range expansion.


It took a while to run out of bulls, but the market finally made a new low for the day at noon. Followed by a test of the morning low which was also the Pivot of the day.
Note that Jobless Claims will be reported on Wednesday, since the US government has a holiday on Thursday. However, both stocks and futures markets will be open on Thursday, but without bond markets.
Charles

Saturday, November 6, 2010

ES Futures End of Day Charts 10/05/10


Typically of the usual pattern, we got a below average range following a large range day.


As the market traded above R1, I was wondering if you really would get a below average range day. Then the $TICK started to show a bearish divergence as the futures made a new high. The 5-minute closes below R1 began to confirm that we might indeed get a below average range day.
Charles

Thursday, November 4, 2010

ES Futures Morning Review 11/04/10


Early on, the bulls looked like they may be losing momentum and the gap might close, but the bulls have been strong enough to keep the market above support lines. R2 is now support.
Charles

Monday, November 1, 2010

ES Futures Morning Review 11/01/10


Again following a NR7 day, R3 is the resistance line that the bulls are unable to cross.
Charles

ES Futures PreOpen Review 11/01/10


We have another NR7 bullish breakout. As a reminder, the above chart is for 10/25/10, which is the day after a NR7 day last week.


We may see some profit taking like last time. Watch the market reaction at support and resistance prices.

Charles