Monday, March 31, 2008

ES Mid-Day Review - 03/31/08


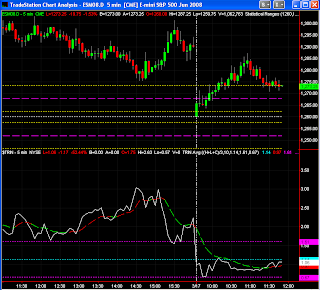
The market spent the morning making a series of three wave formations, and in the process, making higher highs and lows; thus, breaking a downward trend in momentum. Another telltale sign of upward momentum is that the downward correction was smaller in magnitude than the upward swing waves.


The NYSE Advance - Decline Line is positive and trending upward. Not quite as strong as I like it, but not all setups are perfect. $TICK started trending higher after the correction phase was over, indicating that the market may want to trend higher for the short term.


Price momentum on the 1 Minute ES Chart turn long at 1119 ET, and a good place to go long as it turned out.
Charles

ES Pre-Market (03/31/08)


Overnight session has the market still making lower highs and lows.

Don't forget about the 0945 ET NAPM Report.


Charles

Sunday, March 30, 2008

Longer Term View - 03/30/08


Looking at the yearly and monthly opens and pivots shows a continuing weak market. Each month's pivot is still trending lower, and the current close is below the 2008 pivot.


The market is still being speezed between the weekly 200 SMA and Daily 50 SMA.


Charles

Saturday, March 29, 2008

Trade Analysis - 03/28/08

March is not my most favorite month of the year. Property Taxes and Income Taxes to various level of government are paid. A very expensive month. This is true of everyone. And, it may be one of the reasons why the end of March is typically negative for the stock market. Many pull funds out of the market to pay taxes.


The 1000 Tick Chart is a good way to see patterns, since it is not dependent on time. The last few days has seen a series of lower highs and lows formed with 38 - 62% corrections.
Looking at one of these as a trading opportunity (1330 ET on 03/28/08), we see that the MACD of the On-Balance-Volume is showing a downtrend in momentum.


At the same time, the NYSE Advance - Decline Line is making a Pivot High that is lower than the previous Pivot Low. I like to see this as confirmation that momentum is negative in the cash market. The opposite is true for Long trading opportunities (NYSE Advance - Decline Line making a higher Pivot Low than the previous Pivot High).
Also, the Long Term Momentum of the $TICK is negative, and the Short Term Momentum is turning negative at 1322 ET.


In the last post, I briefly described an Indicator called the Pivot Moving 2 Indicator. I have changed the Input labels for clarification purposes and renamed the indicator Pivot EMA Mom Indicator (see code below). I also am using a PaintBar called the Pivot EMA Momentum PaintBar (see code below), which uses the same parameters as the Indicator. So when the Indicator turns negative, the PaintBar turns Red, and when the Indicator turns positive, the PaintBar turns Green. Positive indications is when the 8 period (H+L+C)/3 pivot is larger than the 20 period EMA, and vice versa for a negative indication. I find it to be a good momentum indicator, and helps my trading timing.
At 1330 ET the price momentum turned negatve as indicated by the Indicator and Paintbar. A good place to place a short trade. OBV is negative, NYSE Advance - Decline is negative, $TICK is negative and price momentum is negative. IT DOES NOT GET BETTER THAN THAT!


Charles

Thursday, March 27, 2008

ES Mid-Day (03/27/08)


The market was spooked this morning with negative news for financial and tech stocks. However, the market has regained much of its earlier loss.
I am playing with a new indicator, which is setup for a 1 minute chart (see code below). This indicator calculates a Pivot (Yellow/Magenta Line) and a 20 period Exponential Moving Average (EMA) (White Line). The Pivot is the sum of the Highest High of the last 8 bars, the Lowest Low of the last 8 bars and the close of the current bar divided by 3. When the Pivot is less than the 20 Period EMA, it is Magenta. When the Pivot is greater than the EMA, it is yellow.
For shorting, I wait for the market to make a new pivot low, retest to the high side and then begin trending down indicated by the Pivot color change, which is where I like to short. Long trades are just the opposite. The $TICK is a good confirmation of a new trend developing.


Charles

"The Disciplined Trader" - "The Steps to Success"

This is a summary of the "Steps to Success" in Chapter 16 of Mark Douglas' book "The Disciplined Trader: Developing Winning Attitudes". I read this summary daily to properly focus my mind before the trading day begins.

The Disciplined Trader

STAY FOCUSED ON WHAT YOU NEED TO LEARN

Focus on Market Structure rather than money.

There is nothing worse than missing a “Perfect” opportunity; however, there really isn’t anything to miss as long as price keeps changing, there will always be another opportunity.

DEALING WITH LOSSES

Predefine what a loss is in every potential trade

Execute your losing trades immediately upon perception that they exist.

BECOME AN EXPERT AT JUST ONE MARKET BEHAVIOR

Let other opportunities pass.

Release anxiety to trade too often

Eliminate the psychological damage of fear. The trader’s past mistakes will generate so much fear that he won’t be able to execute his trades properly or at all.

Perception and execution of opportunities are separate skills. They can and do work in tandem if there are no mental components blocking execution.

LEARN HOW TO EXECUTE A TRADING SYSTEM FLAWLESSLY

There is no guaranteed income in trading.

Patterns that repeated in the past may not repeat in the future.

Even though all systems have a percentage of losers, do not try to outguess your trading system.


THINK IN PROBABILITIES

“You will want to determine the prevalent beliefs being expressed in the market and how those beliefs will affect price movement. That identification process requires a detached objective perspective, where you are watching and listening to what the market is telling you, instead of being focused on what the market is doing to you personally.”

BE OBJECTIVE

You feel no pressure to do anything, and have no feeling of fear.

You recognize what the market is telling you, and this is what you need to do.

You are not focused on money but on the structure of the market.

MONITOR YOURSELF

Monitor yourself by knowing what you are thinking about and what market information you are focused on.


Charles

Pre-Market Review - 03/27/08


The S&P 500 Index closed just above the support level of 1340.


Yesterday was an interesting tug-of-war between the bulls and bears. The $TRIN trended up all day indicating an increase in underlying selling pressure. However, the NYSE Advance - Decline Line also had a slight trend in the up direction indicating an increase of advancing issues over declining issues, though the indicator remained in negative territory all day. The net result was that the Futures were down for the day, but only slightly.


The $TICK also saw an upward trend in the afternoon indicating more upticks than down.

The ES Futures had an interesting tumble after the close of the cash market, but in overnight activity, the futures is back to the 1340 - 1344 area in the early morning hours.
The end of March is typically bearish, but the market is hanging tough at the 1340 area. April is typcially bullish for the large caps.
GDP at 0830 ET
Jobless Claims at 0830 ET
Help Wanted Index at 1000 ET (Minor Report)
Natural Gas at 1030 ET
5-Year Note Auction at 1300 ET
Charles

Wednesday, March 26, 2008

Pre-Market Review - 03/26/08


The overnight activity has remained within yesterday's trading range. Yesterday was an Inside Trading Day and (Narrow Range) NR4 and NR7 day. Yesterday, the market found support near a 50% correction of the previous day's range.
In the next day or two, look for a breakout of yesterday's range, but watch out for false breakouts. True breakouts should have expanded ranges per bar and increased volume.
Durable Goods Orders at 0830 ET
New Home Sales at 1000 ET
Crude Status at 1030 ET
2-Year Note Auction at 1300 ET
YESTERDAY'S REVIEW


The long term average of the $TICK pivot ((H+L+C)/3) remained above zero most of the day indicating a more bullish sentiment than bearish. This resulted in an uptrend most of the afternoon following the 50% correction in the morning.


The $TRIN is not always a reliable indicator. Sometimes the $TRIN will show increased selling pressure with the futures market showing a consistent uptrend.
Yesterday, however, the $TRIN did confirm an increase in bullish sentiment in the afternoon with a $TRIN trend to the downside, and stabilizing near the pivot number for the previous day.


The NYSE Advance - Decline Line confirmed the futures uptrend by making higher highs and lows following the morning's correction.
Charles

Tuesday, March 25, 2008

Pre-Market Review - 03/25/08


In overnight activity, the ES Futures is continuing to make lower highs and lows. If we get a normal correction to Monday's uptrend, the market should find support between 1337.75 and 1346.75. Interestingly, 1340, which is support on the 60 minute chart, falls within this range. If the market closes below 1340, expect more downside to follow in coming days.
Consumer Confidence Report at 1000 ET
4-Week Bill Auction at 1300 ET
European Markets go back to closing at 1130 ET

May Light Crude is finding support at 98.5.


The Euro is firming against the dollar.
Charles

Monday, March 24, 2008

S&P500 Index Close Above 1340


We finally have a close above 1340 for the S&P 500 Index. The market will probably test this level for support.

Charles

ES Futures Morning Session (03/24/08)


The $TRIN Indicator made a lower low at 0952 ET, which was 8 minutes before the 1000 ET Economic Report for the day was issued. For the remainder of the morning, the $TRIN traded near Friday's Pivot of 0.72 and below most of Friday's values.

The NYSE Advance - Decline Line traded above Friday's highs and kept climbing, all of which indicated a bullish Monday Morning.


The $TICK long term average confirmed the bullishness by remaining above the zero line all morning. Market Structure also remained bullish by continuously making higher highs and lows.


Charles

Pre-Market Open Review - Monday (03/24/08)

The European Markets are closed today.

Existing Home Sales at 1000ET
3,6-Month Bill Auctions at 1300ET


One of the things that I like to look at is the $TRIN Pivot ((High+Low+Close)/3) relative to the Futures sentiment. If the ES futures close above the 0930 ET open, it is a bullish day and bearish day if close is below 0930 ET open. If the $TRIN is signifantly above the previous day's pivot, the futures typically have a bearish day, and vice versa for a bullish day. Not an absolutely perfect indicator, but a good one to follow.


The S&P500 Index is back at resistance. Friday was also an inside day relative to Thursday.

Overnight action made a higher high on low volume.
Watch the open of the $TRIN, and use NYSE Advance - Decline Line with market structure as confirmations of market sentiment.
Charles

Saturday, March 22, 2008

Exercising the Trader's Brain

READING AND THINKING OUT LOUD


As stated in the article by Litemind, "Solve Your Problems Simply by Saying Them Out Loud", communicating out loud has several advantages over thinking silently:

1. You are forced to clarify your thoughts and state them in objective terms. Language is a tool of thought.

2. By explaining your thoughts to someone else or pretending to explain to someone else, you are forced to make "your knowledge and assumptions explicit, which often accesses different or overlooked data, and thus access entirely new avenues of thought".

3. "Saying the problem out loud engages many more areas of the brain than merely thinking about it."

This last point is also stessed in the article "Brain Tips for Busy People" from BrainReady:

"Reading out loud exercises your brain in a way that reading silently does not. It essentially requires that you process the information you're reading TWICE - the first pass is the basic comprehension, the second pass is remembering how to make the right sounds.
Actually, there are multiple brain-taxing activities happening simultaneously: there's advance scanning (reading ahead) involved so that your brain is also forced to read ahead in order to prepare the translation to your speech faculties, including all intended inflections that are contextually relevant to the sentences in-progress. And then when you count that you are also listening to yourself as you read, modulating your timbre and volume in real-time as you hear how you sounded (all while scanning ahead and speaking and thinking about the contents of what you're reading), it becomes clear just what an engaging, taxing exercise reading out loud really is."


More importantly, the details that you say out loud, especially said out loud many times, will be the information that you will remember in greatest detail later in the day.


In conclusion, if you put in your trading journal information that you believe should be remembered in great detail to improve your trading performance, you should read this information out loud many times to engage many parts of your brain, and allow this information to become remembered in great detail during the trading day and during the heat of trading battle.


MUSIC FOR YOUR BRAIN HEALTH?

In this article by BrainReady, it mentioned the results of a study by Dr. Charles Emery of Ohio State University, that showed how listening to music while exercising can double the performance of verbal fluency tests. The music used in the test was Vivaldi's "The Four Seasons".

It continues to mention that "Several other research studies have illustrated how listening to music is a more complex endeavor than it seems on the surface: the human brain has to sort out tones, timing, and sequencing of various sounds, in order to comprehend music. It is believed that the frontal lobe of the brain is stimulated and activated by listening to music, as it is the part of the brain that is associated with higher mental functions such as thinking abstract thoughts, or planning for the future."


What an easy way to brain exercise - listen to music.


Perhaps a good way to prepare your brain for some difficult tasks, such as trading, is listening to music before and during trading.


Charles

Friday, March 21, 2008

Linda Raschke, Momentum, Structure, Indicator Analysis

On Linda Raschke's Web Site , she has three MarketVU Presentations that I like to review from time to time. My favorite is "Classic Swing Trading - In its Purest Technical Form" , which includes discussions on how momentum precedes price and basic market structure. The other presentations are "Tricks On Trading The First 30 Minutes" , and "Identifying Conditions Preceding The Best Breakouts" . I attended one of her three day seminars a few years back. These presentations are the same as what you get in the seminars.


The chart above illustrates a good way to analyze the NYSE Advance - Decline Line and $TRIN throughout the day for clues in underlying market sentiment to aid in trading the ES market.
In the early morning trading on Thursday (03/20/08), the $TRIN started to show signs of mild negative sentiment, but the NYSE Adv - Decl indication remained positive (higher highs and lows) until 1144 ET. Apparently, there was increasing selling volume into the market advance, but it was not strong enough to stop the advance in prices.
We then had the typical lunchtime correction, followed by a continuation of the uptrend in the afternoon session. The NYSE Adv - Decl indicator signaled the end of the correction at 1322 ET with a higher high starting a new uptrend. The $TRIN turned positive at 1334 ET, confirming the positive sentiment. The market saw a mild correction going into the energy market close, followed by a continuing of the uptrend until 1528 ET.


The ES chart above shows the ES price reaction to the underlying sentiment. The $TICK turned positive at 0946 ET following an early test of previous lows. As the uptrend ended around 1130 ET, we can see that the $TRIN and $TICK preceded the NYSE Adv - Decl indicator by 15 to 20 minutes in signaling the end of the morning trend.


The lunchtime correction was a nice 50% correction. The afternoon uptrend helped form good market symmetry relative to the morning uptrend.


The chart above shows the afternoon session in relation to the underlying sentiment indicators.
Again, the $TICK preceded the other indicatos in signalling the end of the correction. The NYSE Adv - Decl Line is a good conformation tool, as is the $TRIN. The afternoon uptrend officially ended at 1528 ET.
One addtional comment is that the $TRIN did signal an overall bullish sentiment by remaing below the values of Wednesday most of the day Thursday.
Charles

Thursday, March 20, 2008

Pre-Market View - Thursday (3/20/08)


The dollar is strengthening for a short term correction, and light crude is dropping in price with the June contract now below $100 per barrel.


Yesterday's decline was almost exactly a 50% correction of the recent bullish move, which may provide support.


Pre-Market activity shows some bullishness. Look for a $TRIN that is lower than yesterday's level and a downtrend from the open value for an indication of a bullish day. Watch the NYSE Advance - Decline Line as confirmation. Vice Versa for a bearish day.
Jobless Claims at 0830 ET
Leading Indicators at 1000 ET
Philadelphia Fed Survey at 1000 ET
Natural Gas at 1030 ET
Charles

Wednesday, March 19, 2008

Morning Session - Wednesday (03/19/08)


The NYSE Advance - Decline Line and $TRIN are still relatively bullish, but less bullish than yesterday.


Sellers waited for the market to make a new high before jumping into the market. The selling pressure created a nice three-wave, symmetrical formation, and found support around the 1328 area. It was after the finish of the symmetrical move that $TICK momentum changed to the bullish sentiment.

The 1000 Tick Chart shows that support came at the top of the equilibrium zone of 1327 - 1322 that was created during the overnight session. At the beginning of lunch, we are seeing some resistance near the 1338 area.
Charles

S&P 500 Index Back to Resistance


The market is back close to that stubborn resistance level at 1340. May see a smaller trading range today, and see volume taper off as we approach a 3-day weekend. However, we do have quadruple witching this week, and Morgan Stanley reported better than expected earnings this AM.


Charles

Monday, March 17, 2008

Afternoon Review - 03/17/08


Afternoon the lunch correction back to the 0930 ET open, the market reversed in the afternoon as indicated by a downtrending $TRIN.


I have a tendency to enter too soon when I sense a reversal. It is best to wait for the test of the last low or high, or at least wait for a 14 period ATR reversal signal and then a correction back to the 20 period EMA for an entry. Anyway, we had a nice reversal move this afternoon.
Charles

Mid-Day Review - Monday (03/17/08)


This morning's session was a good time to be a contrarian. The market was able to correct 50% of the overnight down trending trading range. We will get a good sense of what the afternoon sentiment is after 1300 ET.


The first thing that was noticable this morning was that the $TRIN was much more bullish today than it was during Friday's session. It showed bullishness while the other indicators were still bearish, which is an important divergence to notice.


Both the $TICK and NYSE Advance - Decline Line did not indicate bullishness until around 1000 ET, but stayed rather bullish until the 50% correction was achieved.

This Thursday, 03/20/08, is quadruple witching, and the markets are closed Friday. The market is expecting another rate cut tomorrow from the Federal Reserve.
Charles

Market News Around the World

What Economists Say

Q&A: Bear Stearns Banking Crisis

Market Reactions to Bear Stearns Rescue Attempt

JPMorgan Buys Bear

Concerns About Lehman


Mentioned by Art Cashin on CNBC is the Credit Crisis and Market Panic of 1907. Interestingly is that J. P. Morgan also came to the rescue back then:

MARCH 13TH STTOCK MARKET CRASH: Panic of 1907 Begins with Credit Crisis


Lessons From 1907 Market Crashes


Steve Forbes - Eliminate mark to market accounting of exotic securities and shore up $.


Charles

Market Structure/ Symmetry - Morning (03/17/08)


In addition to Bear Stearns, liquidity issues and interest rates, we have the Empire State Mfg Surver at 0830 ET, Industrial Production at 0915 ET, Housing Market Index at 1300 ET and Bill Auctions at 1300 ET.


Charles