Thursday, March 29, 2012

S&P 500 Index April Charts For The Last 5 Years


The above charts are the S&P 500 Index for the last 5 years.

Each year of the last 5 years has April closing higher than its open for the month. The low for the month occurred on the first day of the month in the years 2007, 2009 and 2010. The years 2008 and 2011 made its monthly low in the middle of the month.

Below are the point gains for April:

  • 2011: + 34 points
  • 2010: + 15 points
  • 2009: + 79 points
  • 2008: + 59 points
  • 2007: + 61 points
Charles

ES Futures Morning Session 03/29/12


The Advance - Decline Line is still trending lower, indicating continued selling in the second to last trading day of March. This has helped keep the ES Futures below S1 and yesterday's low for most of the morning.

The last trading day of March is also usually weak. We may see some bargain hunting in anticipation of a more bullish start in April. The first week of April is typically more bullish than the last week of March.

Charles

Wednesday, March 28, 2012

ES Futures 03/28/12


Both the ES futures and the S&P 500 Index are at their 10-day moving average. The Pivot of the Advance - Decline Line didn't quite make it to the -1000 line. So, we will have to see if most of the selling is done, or if there is more to come. The end of March is typically weak.

Charles

Monday, March 26, 2012

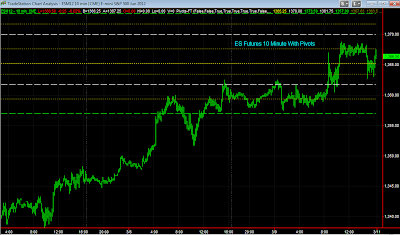
ES Futures Pivots For Tuesday 03/26/12


Trading Pivots for tomorrow.

Cup and Handle formation on the 10-minute chart. Gave us a strong reversal.

Charles

Friday, March 23, 2012

ES Futures S&P 500 Index Weekend Charts 03/23/12


We got our higher close from yesterday's close. However, as you can see on the 60 minute chart, the 1395 line is still resistance.

Stay tuned.

Charles

Thursday, March 22, 2012

ES Futures 03/22/12


The market spent the day bouncing between S3 and S2.

The S&P 500 Index is back to its 10-day moving average with the Advance - Decline Line Pivot just below - 1000. There's a decent chance that tomorrow's close will be higher than today's close.

Charles

Wednesday, March 21, 2012

ES Futures Morning Session 03/21/12


The market tested yesterday's high and crumbled. The low of the first 30 minutes was violated, which set up a bearish market sentiment for most of the morning. So far, the market is staying above yesterday's low and S1.

Charles

Tuesday, March 20, 2012

ES Futures Morning Session 03/20/12


Some in the market feel that they are picking up bargains at S2, but not enough of a bargain to trade the market past S1. A stock market at its 10-day moving average would be a better bargain.

If the Advance - Decline Line finishes the day at or below - 1000, tomorrow would have a good chance of finishing up for the day.

Charles

Monday, March 19, 2012

ES Futures Morning Session 03/19/12


R1 was resistance until the start of the last hour of European trading at 1130 ET. At that point, resistance faded and the US market bounced above R2.

Charles

Friday, March 16, 2012

ES Futures And S&P 500 Index Weekend Charts 03/16/12


Today was the most narrow range of the last 7 days - an NR7 day. Watch for a high volume break out of this small range.

Charles

ES Futures Morning Session 03/16/12


The market so far this morning is fading R1. Not unusual with the market having had a few days of upward movement. A good place to take some long position profits.

Charles

Thursday, March 15, 2012

ES Futures Morning Session 03/15/12


The Advance - Decline Line is more positive than yesterday, but still at or below the zero line. The $TICK Indicator has not gone above + 600 all morning. In all, there is still selling pressure in the market. However, the sellers are patient enough to wait until the market tests a resistance point, which this morning happens to be the R1 line.

The bottom chart shows the S&P 500 Index and the Pivot of the Advance - Decline Line. Since last December, when the A-D line pivot touches are goes below -1000, the next day typically closes above the previous day's close. Since last December, this happened 6 out of 8 times.

Charles

Wednesday, March 14, 2012

ES Futures Morning Session 03/14/12


This morning's action is retail traders arriving late to the party. They drove the market to a new high with lower upward momentum as indicated by the $TICK indicator and the Advance - Decline Line. The market is also at the top of its channel.

So, the market reached its morning peak at 1020 ET, and is now below yesterday's high. Hedge funds are now adjusting their portfolio's for option contract expiration this week - Triple Witching.

Charles

Monday, March 12, 2012

ES Futures Morning Session 03/12/12


The Advance - Decline Line confirmed some selling pressure relative to the last 3 trading days. However, the market so far is staying above Friday's low and the 10-day moving average.

Charles

Friday, March 9, 2012

Week Of And Week After March's Triple Witching Friday 3/09/12


The above charts illustrate the week of and the week after March's Triple Witching Friday for the 5 years from 2007 to 2011. In 2008, however, the third Friday of the month was a Good Friday holiday, so the last day of trading for the equity options was Thursday before Good Friday.

TW on the charts is Triple Witching. SP on the charts is Saint Patrick's Day.

The one thing that really stands out during the last 5 years is that the Monday after Triple Witching closes substantially higher than its open. Except for 2010, the close of that Monday is higher than the previous day's high.

In the years 2007, 2009 and 2010, Triple Witching Friday had a close lower than its open. 2011 was almost a neutral close day.

Except for 2008, the following week has closed higher than the close of Triple Witching Day.

Charles

Weekend Charts 03/09/12


Remember to "Spring Forward" with your clocks Sunday morning.

Next Friday is Triple Witching and is also the day before St. Patrick's day.

Charles

ES Futures Morning Session 03/09/12


We got another breakout past R1 in the morning session. The Advance - Decline Line is strong again confirming the bullishness. R2 is currently resistance.

Perhaps we will get a March to May bullish trend after all.

Charles