Saturday, December 31, 2011
Analyzing the Stock Market and Equity Futures 12/31/11


I like watching the 1 Minute chart of the ES Futures. It helps me judge market strength when it is testing extremes.
$TICK and $TIKI
Yesterday, the market tested the previous day's high just after 1000 ET. A strong move typically involves the $TICK hitting + or - 800 and the $TIKI hitting + or - 24. In this case, as the market tested the previous day's high, the $TICK was well below +800 and the $TIKI was well below +24. A rather weak effort, and the result was a down trend for the rest of the day. There just wasn't any major buying programs in the market to push it higher.
$TRIN
The $TRIN closing at extremes on its daily chart is an interesting study. Sometimes extreme market moves signal a short term exhaustion in its current trending direction. When the $TRIN closes above 2 on an extremely bearish day, the next day may see a rally to the upside. Likewise, when the $TRIN closes below 0.6 on an extremely bullish day, the next day may tumble to the downside a little.
I looked at a small market sample to test this assumption. In this sample, the $TRIN closed above 2.0 - 15 times, and it close below 0.6 - 13 times. When it closed above 2.0, the next day was bullish 60% of the time. When it closed below 0.6, the next day was bearish 54% of the time. Not something that you want to bet the farm on, but something to be aware of when this happens.
The last chart is the Pivot lines for Tuesday, 1/03/12.
Charles
Friday, December 30, 2011


Thursday, December 29, 2011

ES Futures End-of-Day Review 12/29/11


Not a lot to talk about today. The market stayed above its 0930 ET Open and spent the rest of the day challenging R1. Another below average range day.
Charles
Wednesday, December 28, 2011

ES Futures End-of-Day Review 12/28/11


A strong down day with range expansion following several narrow range days. On the bullish side of things, the market is still above its 10-day moving average.
Euro falls to 15-month low
Charles
ES Futures Morning Session 12/28/11

The ES Futures this morning broke to the down side with support lines unable to provide support.
US Navy Won't Allow Iran to Close Strait
Good Demand for Italian Bonds
ECB's Balancxe Sheet Expands to Record
Charles
Tuesday, December 27, 2011
ES Futures Stalls At December 8 High And R1 12/27/11


As you can see, the market stalled today just below the December 8 high, today's R1 and the upper end of its Keltner Channel. Ultra low range today also.
Charles
Friday, December 23, 2011


Thursday, December 22, 2011
ES Futures End-of-Day Review 12/22/11

A low volume day with few sellers in the equity markets. The combination R1 - 0930 open price held as support. It is interesting that the futures could not break the R2 resistance until the equity market closed.
Charles
Wednesday, December 21, 2011
Celtic Solstice - God Rest Ye Merry Gentlemen
Winter Solstice occurs tomorrow,Thursday, at 0530 UTC or 12:30 AM Eastern. From that point on, the sun goes back north in the daytime sky.
Charles
ES Futures End-of-Day Review 12/21/11


Narrow range day following a wide range day, which is the normal pattern. The market found support at S1, which today also corresponded with the 10-day moving average.
Charles
Tuesday, December 20, 2011
ES Futures End-of-Day Review 12/20/11


What a difference a day makes. Various support levels held all day. The S&P 500 is also back above its 50-day moving average, which is bullish.
Charles

Monday, December 19, 2011
ES Futures End-of-Day Review 12/19/11
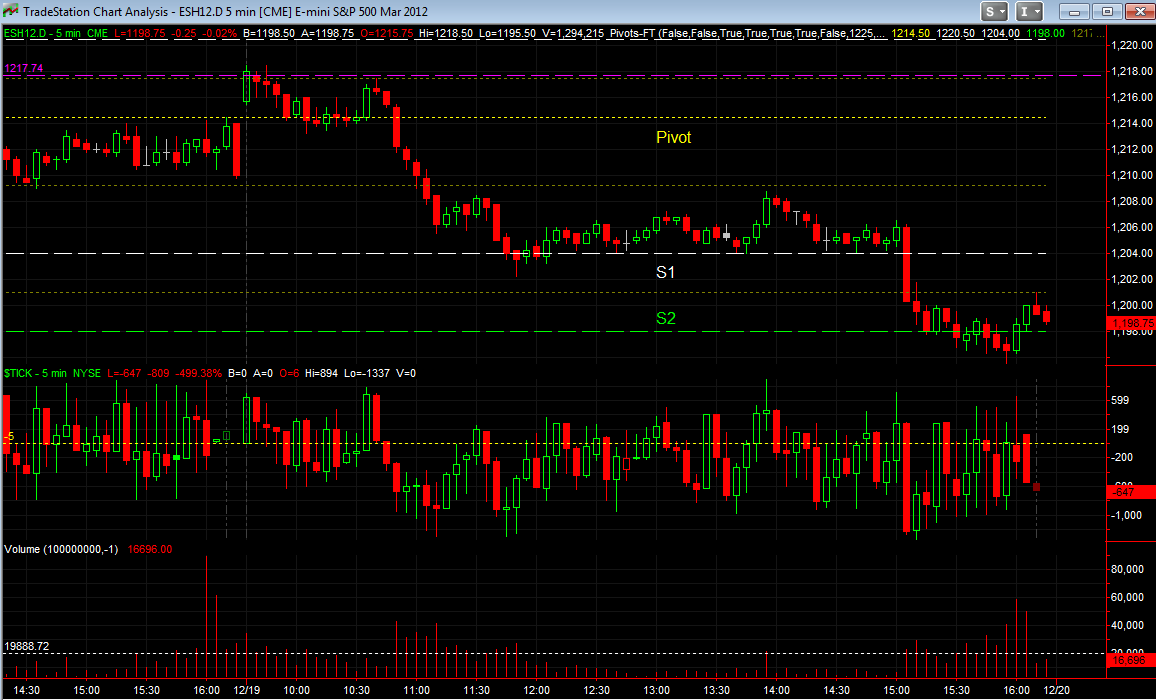
The ES futures completely a three-wave move to the down side. In the afternoon, Friday's low was resistance.
Charles
ES Futures: Draghi and Financials Drag Market Down 12/19/11

A cautious market found resistance at its 0930 ET open price.
It is debatable whether comments by the president of the European Central Bank, Mario Draghi, or the recommendation to increase the disclosure requirements of large banks regarding their cash reserves dragged the market down. It is probably the combination of both.
Charles

Friday, December 16, 2011
The ES Futures Fade R2 12/16/11


We got a good bearish $TICK divergence as the ES Futures tested R2. If you like to fade the early morning move, this is a good place to do it. $TICK divergences are typically more reliable near test of support or resistance lines.
Charles
Wednesday, December 14, 2011
ES Futures 12/14/11

The market spent most of the day bouncing around S1. This is common with a narrow range day. The true resistance today was the 0930 ET open price.
Charles
Tuesday, December 13, 2011
ES Futures and the Floor Trader Pivots 12/13/11

The 5-minute ES Futures chart is a great tool for trading the Floor Trader Pivots. Typically, if a 5-minute bar closes above or below a pivot line on a test, the market has a high probability of reaching, at least the half way point between pivot lines. Also, making trading decisions near the pivot lines keeps your risk low.
Charles
Trading On European News 12/13/11

The Europeans will come together and solve their debt crisis problems - No they're not - Yes they are - No they're not - Yes they are - No they're not - ..........
Charles
Monday, December 12, 2011
ES Futures End-of-Day Review 12/12/11

The Europeans are in a bad mood again. After trading below S2, the market stayed there for most of the afternoon. The little buying spurt in the last half hour may give the bulls a little encouragement.
Charles
Friday, December 9, 2011


ES Futures - Three-Wave Bullish Move - Morning 12/09/11

Nice three-wave bullish move on the 5-minute chart in the morning session today.
Charles
Thursday, December 8, 2011
ES Futures End-of-Day Review 12/08/11


The market finally traded down to its 10-day moving average on European economic fears - again. Actually, test of the 10-day moving average should have happened days ago.
The S&P 500 index could not trade above its 200-day moving average, which is acting as resistance. Its 50-day moving average is now above the 100-day moving average, but still below the 200-day moving average. A slight positive for the broader market.
Charles
Wednesday, December 7, 2011
ES Future End-of-Day Review 120711

We got the 1030 to 1045 ET reversal off of S2. The market ended up more positive than I thought it would this morning. So, we are all the way back to yesterday's high.
Charles
Tuesday, December 6, 2011
ES Futures End-of-Day Review 120611


The ES futures spent most of the day in a very narrow range. We did get a breakout from a small wedge to R1, but then the market crumbled back to the Pivot. Longer term bulls are more likely to enter the market closer to the 10-day moving average.
Charles
Monday, December 5, 2011
ES Futures End-of-Day Review 12/05/11

We finally got some profit taking. In the afternoon, the morning's low became resistance with the Pivot providing support.
Charles
ES Futures Morning Session 12/05/11

Lower volatility today. Support is Friday's high, and resistance is R2.
Charles
Friday, December 2, 2011


ES Futures Anticipating Good Employment Report 12/02/11


The ES Futures is anticipating a good Employment Situation Report this morning. The market, however, is reaching previous resistance levels. Be cautious since this could become a "Buy on the rumor and sell on the news" event.
Of course, if the market trades above resistance on good volume, then resistance becomes support.
Charles
Subscribe to:
Posts (Atom)