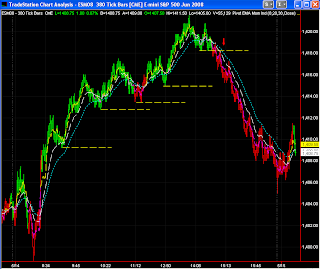
Saturday, May 31, 2008

ESM08 Range Analysis

Here is a quick look at ESM08's 10 Day Average True Range and the daily True Range. The date period for this data is from 3/11/08 to 5/30/08. Also, the data is based on the time period of 0930 ET to 1600 ET.


The first observation in the chart above, which compares this contract's 10 Day ATR with the Daily True Range, is that the market has calmed down considerably from the March Madness period. The 10 Day ATR has now settled in the 18 point area.

If the Daily True Range during this time period was higher than the previous day, 16 out of 26 times or 62% of the time, the following day's True Range was lower by an average of -12.25 points, ranging from -22 to -1.25 points. 38% of the time the Daily True Range was higher by an average of +6.25 points, ranging from +20.5 to +0.25 points.

If the Daily True Range was higher two days in a row, the following day's range was lower 71% of the time (5 out of 7 times) by an average of -14 points, ranging from -18.5 to -5.5 points. 29% of the time (2 out of 7 times) the following day's range was higher by an average of +3.75 points, ranging from +6 to +1.5 points.

If the Daily True Range was higher three days in a row, the following day's range was lower 100% of the time (2 occurrences) by an average of -8.75 points (-6 and -11.5 points).

If the Daily True Range was lower than the previous day, 73% of the time (16 of 22 times) the following day's range was higher by an average of +10.5 points, ranging from +33 to +0.5 points. 27% of the time, the following day's range was lower by an average of -8 points, ranging from -13.25 to -2.75 points.

If the Daily True Range was lower two days in a row, 67% of the time (4 of 6 times) the following day's range was higher by an average of +6 points, ranging from +13.5 to +1. 33% of the time the following day's range was lower by an average of -9.75 points (-6.5, -13.25).

The Daily True Range being lower three days in a row occurred twice with the odds either way being 50/50.

Once the Daily True Range was lower four days in a row with the following day's range being 1 point larger than the previous day. Both the three and four consecutive days with lower ranges occurred in mid-March.

Charles

Friday, May 30, 2008

Day After a Wide Range Day

Yesterday, based on the Open Pit Hours Statistics, the True Range was 18.75 points, which was larger than the 10 average of the True Range of 17.9. So yesterday was a wide range day, and wider than the average. It is not a rule anchored in cement, but the following day of a wide range day is typically a more narrow range day, which can lead to whipsaw type of action. In other words, no clear trend, and continuous tests of the highs and lows of the day.

So far, today is a very narrow range day and an inside day - no clear trend and tests of the highs and lows. I do not know if it will end up that way, but that is the way the market is shaping up so far today.

Always remember that today will probably not be anything like the day before. Do not fall into the mental trap of thinking that today's market will be a carbon copy of yesterday. Always look for today's market to be different than the day before.

Charles

Thursday Afternoon - 05/29/08


In the afternoon session, as the ES Futures was making a new high at the close of the Energy Pits, the 15 SPDR Stock Stochastic (based on a 6.5 hour analysis) was making a lower high.


The $TICK Pivot 6 period EMA was also making a lower high. However, notice that the late down trend in the ES Futures was occurring on increasing buying volume in the equity market. In the overnight market, the ES Futures did not crash, but stayed near close of Thursday.


I'm not one to enter at tops and bottoms. I prefer to see price confirmation of trend change by seeing a higher pivot high or lower pivot low, and then wait for a corrective or reactive move before entering. The ES Futures confirmed a trend change by making a new pivot low at 1438 ET, and completed a 50% reaction at 1450 ET just before the bond market close. This is my preferred entry point.

I use the indicators to indicate a change in trend sentiment, but wait for price confirmation - a personal preference.

Charles

Thursday, May 29, 2008

Thursday Morning - 05/29/08


A lot of emotional trading this morning centered around Oil. Why didn't the market trade down after the bullish oil inventory report? I don't know.

$TRIN was slightly more bearish relative to yesterday, but the $TICK and NYSE Advance - Decline Line remained above the zero line. Buying kept returning into the ES market each time it tested the 0930 ET open.

The end of May and the first few days of June are typically bullish. Apparently, irregardless of what oil is doing, there are investment firms out there that need to do some end-of-month buying.

Interestingly, Financials remained strong all morning.

I did make a profit this morning, but it wasn't easy.

Charles

Wednesday, May 28, 2008

Wednesday Morning - 05/28/08


This morning's set up is almost a mirror image of yesterday morning. Today the market tested yesterday's high and traded down. When using a 380 tick chart, the first reaction to a reversal move tends to peak just above the 38 period EMA. Wait for a bar with a down close, and use the high of the previous bar as a stop loss. Risk is small, and reward is larger.


As confirmation of profit taking, the futures opened above yesterday's high, but the 15 SPDR Stock basket opened below yesterday's high and trended down. Thus, confirming the down move in the futures.


The NYSE Advance - Decline Line also confirmed the weakness in the futures with a steep down trend.

Charles

Additional Review of Tuesday


Remember that $TRIN takes into consideration Up Volume versus Down Volume in the large cap equity market. This is a simple and good way of determining volume confirmation of up and down moves in the futures market. The $TRIN on Tuesday was substantially lower than Friday's levels, and the $TRIN showed a steady downtrend (bullish indication) all Tuesday afternoon confirming the markets up move after 1200 ET.

Additionally, the $TICK Pivot MA remained above zero all afternoon for additional confirmation.


The ES Pivot has closed above its 38 period (30 Minute Chart) EMA for the first time in about 5 days. The downtrend of the $TRIN indicator can be better seen on this chart. Notice also that the $TICK Pivot MA's turned positive on Friday afternoon.
Charles

Tuesday, May 27, 2008

Tuesday's Activity - 05/27/08


As the ES Futures was testing Friday's low, the NYSE Advance - Decline Line was making a higher low, and the $TRIN was making a lower high. This indicated an overreaction by the futures market, which gave us a nice bounce to the upside.


The 15 SPDR Stock Stochastic was also making a higher low to confirm the overreaction of the futures market in testing the previous low.
Charles

Tuesday Review - 5/27/08


The S&P 500 Index closed Friday not only below May's open, but also closed below May's low, which is a negative for the market. Expect a three wave correction relative to the May 19 high (Initial Swing Wave - Corrective or Reactive Wave - Final Impulse Wave).


The ES Pivot is remaining below its 13 Period EMA. On Friday, the $TRIN was at its highest of the past several weeks, and the NYSE Advance - Decline Line was at its lowest. We may see the Corrective (Reactive) Wave soon.
Charles

Friday, May 23, 2008

Friday Morning - 05/23/08


I'll start an early three-day weekend.

Following a NR7 day, the market is giving us a much wider range day to trade, and the ES market is simply following a typical Fibonacci three-wave pattern. You can increase your trust in these patterns completing when you suspect a wide range day, which usually follows a narrow range day especially a NR4 & 7 day.


The MA of the $TICK pivot remained below zero most of the morning with the futures meeting resistance at the upper average of the nearest range extreme. The market eventually traded below the -3 Standard Deviation indicating a weak market today. This is confirmed with an up trending $TRIN indicating large selling volume.

The NYSE Advance - Decline Line also is trending down for further confirmation of a weak morning market.

Charles

Thursday, May 22, 2008

End-of-Day Musings - 05/22/08


Today is a Narrow Range 4 and 7 Day (NR4 & NR7). We should see wider ranges soon.


As I have observed before, components of the Statistical Open Range tend to act as support and resistance. All components are calculated relative to the 0930 ET open, and use the 10-day averages and standard deviations. Sometimes, when using a 5-minute chart and candlesticks, hammers form at these points, as marked by the arrows. After the hammers form, the market tends to move rapidly to the next support or resistance level. Just a casual observation.
Charles

Thursday Morning - 05/22/08


The market took a little corrective bounce this morning with the $TRIN trending down and the NYSE Advance - Decline Line trending up from yesterday. However, the market is still in bear mode overall.


The Consumer Staples, Financials, Health Care and Technology Sectors were the strongest this morning. Not a raging bull, but a corrective bounce.


The ES Futures traded mostly above the 0930 ET open, bouncing from the open to the +Average Nearest Daily Range Extreme, and the +1 and +2 Standard Deviations. A Narrow Range morning, which is typical following a Wide Range Day.

Charles

ES Technical Structure


The ES Futures tested the 1409 level 3 times before breaking out. The major difference between point 4 in the chart above and the other 3 test points is that at point 4, the FOMC Meeting Minutes was released. Apparently, traders were surprised to learn that the economy is weak.

Charles

Wednesday, May 21, 2008

Wednesday Morning Activity - 05/21/08


The market started out looking like a positive day, but there was one fly in the ointment - an up trending $TRIN. Down volume brought the market down to test yesterday's low. After the test, it looks like up volume is starting to overtake down volume. However, I suspect most traders will wait for the FOMC meeting minutes to be released. Increasing oil prices is not helping either.

Charles

Thoughts on Tuesday's Charts


We did not get the three wave correction as I anticipated, but we did get a Narrow Range Day or a day with a smaller range than the last few days. We also got a double bottom late in the day, with the market currently (AM Wednesday) trading above Tuesday's low. The market was weak, but there was no high volume selling to drive the market substantially lower than Monday's low. The ES market is currently testing Monday's low of 1422.50, which may act as resistance unless the market trades above that level, which then will make it support.

The FOMC Meeting Minutes will be released at 1400 ET. The market may go crazy at that time, depending on what is said in those minutes.


Thought that I would add a chart about Tuesday's Market Structure. Trying to guess where the market bottom will occur can be a costly exercise. I for one am usually too early when I try to guess that the market has bottomed, and have to experience either a loss or some draw down pain as I hold on to my early positions. It is better to wait for the market to show signs of reversing before jumping into the fray. All day yesterday, the market continually made lower highs until the very end of the trading day. And then according to (Frank Tubbs) Tubbs's Swing Rule, expect the market to move upwards above a previous high pivot as far as it had traded below the pivot. And then according to his Law of Proportion, expect the market to retrace 1/2, 2/3 and 3/4 of the previous move.

Charles

Tuesday, May 20, 2008

Tueday Morning Review - 05/20/08


Interestingly, as the Futures has been making lower highs and lows all morning, the NYSE has remained above its pivot low made at 1005 ET. It just is not confirming the lower lows in the futures.


As of 1210 ET, the 15 SPDR Stock Stochastic is also making a higher pivot high.
So, we may get a three wave correction this afternoon.
Charles

Monday's Market Action


Another thing to look at concerning yesterday's start of a morning uptrend is that the ES Futures could not trade below the overnight low. Once above the high of the day, long trades controlled momentum.


The only indicator that may have foretold the afternoon selling was the 15 SPDR Stock Stochastic. As the futures was making a higher high, the stochastic was making lower highs.


Once the $TRIN started making higher pivot highs, and the $TICK started making lower pivot lows, the selling avalanche started. The market did not find any support until it reached the 0930 ET open, and found resistance again at the +1 Standard Deviation. However, the end of day selling did not find support again until it reached the -1 Standard Deviation.


The current high and low pivots are 1430.25 and 1421.75. Watch how the market reacts to these pivots following the 0830 ET PPI Report and the 0930 ET open.

Charles

Monday, May 19, 2008

Morning Review - 05/19/08


The one indicator that suggested a bullish morning was the down trending $TRIN. When the market has a trend day, the nearest range extreme is usually defined early, such as in the first 30 minutes. Today, the buyers entered the market as soon as the ES Futures traded down to the average nearest range extreme on the short side of the open. It found a little resistance at the long side of the open at the other average nearest range extreme. Once past this mark, resistance was again found at the +1 standard deviation of the average nearest range extreme. Once past this point, it became support, which is typical in a strong trend day.

Charles

Interesting Ways That We Can Fool Ourselves

In the diavlog between Joshua Knobe and Laurie Santos titled "Stupid Primates", Laurie Santos describes a test where two groups were paid to lie. On group was paid $20 while the other was paid $1. The group that was paid $20 openly admitted that they lied because they were paid well to do so. The $1 group actually convinced themselves to believe their lie as truth because psychologically they did not want to admit that they would lie for such a small amount of money.

Dr. Vaughen Bell in his "Mind Hacks" blog describes a study by Hilke Plassman where a group of people will rate a cheap wine as high quality if they are first told that the wine is expensive. In a similar study by Francesca Gino , when two groups are given the same advice, but one group gets the advice free while that other group pays for the advice, the group that pays for the advice gives the advice a higher rating than the group that got it for free. In other words, we humans consider paid advice of a higher quality than advice that we get for free, even though the advice is of the same quality.

I am sure that there are many psychological reasons for this phenomenon. One reason is that we just do not like to admit that we made a mistake or have been cheated. Refusing early to admit that we made a trading mistake can be costly. We must first realize and openly admit that we all possess this psychological flaw in our thinking. Then we can tackle the problem of not wanting to limit our losses when the market turns against our position.

Charles

Saturday, May 17, 2008

Weekend Chart Review - 5/17/08


View a past post for an explanation of the Statistical Open Range and Spreadsheet Analysis featured in the chart above.

It does not always happen, but it is interesting when the Average Nearest Extreme of the Daily Range and its Standard Deviation act as support and resistance lines as it did Friday.


Whenever the Futures correct or react to a short term trend as defined by higher/lower pivot highs and lows, I like to confirm the move with the NYSE Advance - Decline Line. If the NYSE Advance - Decline line does not confirm the reaction move, it is usually safe to trade in the direction of the short term trend. In other words, the broad equity market rules over the futures.


Based on a 30 minute chart, the ES pivots have stayed above its 38 period EMA since May 12. Friday we got the highers $TRIN since May 12. There was definitely selling pressure Friday, but it was not enough to trade the market lower than its up trending EMA's.


The closes of the ES open pit session is staying above its two day pivot. The range of the open pit session period was lower than the previous two days Friday, but it was not a Narrow Range 4 or 7 day.

Charles

Friday, May 16, 2008

Morning Review - 5/16/08


As the S&P 500 Index made a new high of the last two weeks, traders decided to take profits. Looking at the 380 tick chart of the ES Futures, the market made an interesting chart formation with a support and resistance line at 1425.50. It was resistance, then became support, and then became resistance again.


Yep, that is one large cow in Somerset, England.

Charles

Thursday, May 15, 2008

Morning Observations - 05/15/08


As the market tested yesterday afternoon's lows, the $TICK was making higher lows and thus not confirming the lows in the Futures. The $TICK Pivot Moving Average turned positive at 1020 ET and gave us a little rally. On a test of the 0930 ET open, a divergence between the ES Futures and the $TICK followed by a hammer candle formation gave us a lunchtime rally.


The NYSE Advance - Decline Line also gave us a divergent signal on the lunchtime test of the 0930 ET open.


As well as the 15 Stock Sector Stochastic.

Charles

Late Afternoon Weakness - 5/14/08


As markets approach previous highs or lows, special attention should be paid to how the market reacts to these points. Yesterday, the ES market approached a previous high pivot around 1350 ET. This is a good time to start evaluating continuing strength or possible reversal.


Using the 15 Stock Sector 6.5 Hour Stochastic, we can evaluate the market's strength based on the last day of open pit trading. As the ES Futures was making a new high, the equity market based on this indicator was not making new highs. This is a possible sign of a reversal.


Around 1450 ET, the ES Futures started to make lower pivot lows based on market structure analysis. As it turned out, this was a good place to short. Remember that you do not have to and should not try to predict the highest high or lowest low of a move. Wait for market structure and momentum indications to confirm reversals.

In addition, the $TICK and the Moving Average of the $TICK pivot ((H+L+C)/3) started to make lower lows at around 1430 ET to signal a possible reversal.
Charles

Wednesday, May 14, 2008

Morning Opportunities 05/14/08


$TICK Pivot higher than yesterday, $ADD (NYSE Advance - Decline Line) higher than yesterday, $TRIN lower than yesterday and the 15 Sector Stochastic higher than yesterday has made long trades the play of the morning, which is the direct opposite of yesterday morning.
Charles

Morning Review - 05/14/08


The market is back in a happy zone with a narrow range of trading. May see another narrow range day, but look for a higher range day soon. Not sure of direction, but the bulls have a slight edge so far.

Consumer Price Index at 0830 ET and oil report at 1030 ET.

Charles

Tuesday, May 13, 2008

Laughter

After starting to trade full-time about 8 years ago, I went through many years of frustrating failures in trying to make a profit at this job. Every time that the market went against me, which was often, I would yell, kick the walls, and just get angry.

Several years ago, I found myself becoming less angry when I would make amateurish mistakes, and instead found myself laughing at what I did wrong. I even did this after losing a great deal of money by holding on to my losses too long. I then realized that I felt better after laughing about these failures, and was able to return to the markets with a fresh and creative view of my trading and the market dynamics. Laughing actually helped me to view my failures as opportunities to learn and creatively look at new trading techniques to eliminate my mistakes.

I was reminded of this while reading Chapter 8 of "A Whole New Mind" by Daniel H. Pink. It talks about Dr. Madan Kataria, a physician in Mumbai, India and author of "Laugh for No Reason" and featured at the Laughter Yoga International web site, who started a Laughing Club in 1995. This group of people meet in the morning and perform a type of laughing yoga, where the mind is cleared and people laugh and be joyful for no special reason other than to be "mind healthy". It is found that laughing reduces stress and promotes creativity and productivity.

So do what I have been doing for several years when the market goes against you - LAUGH! It will help to clear your mind and see your trading techniques and the market in a new creative way.

Charles

Morning Review - 05/13/08


Both the $TICK and NYSE Advance - Decline Line ($ADD) indicated a selling market, while the $TRIN was neutral in the fact that it did not make a lower low or higher high relative to yesterday.


The 15 Stock Sector Stochastic also indicated a selling market all morning.


The ES Futures trended down all morning from the 0930 ET open, and corrected less than 38% of the current down wave. Short trades were the game to play this morning.
Charles