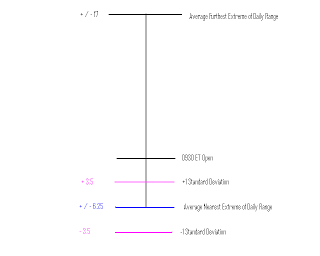
For the ES Futures, 70% of the time, the 0930 ET open is much closer to one of the Daily Range Extremes (High or Low) than the other. Currently, using a 10 day average, the nearest Daily Range Extreme is + or - 6.25 points from the open, with a + or - 3.5 Standard Deviation. The furthest Daily Range Extreme is on average + or - 17 points from the open.
The illustration above shows this relationship to the 0930 ET open.
The nearest extreme is usually identified in the first 30 to 60 minutes of trading. This information is a good way to determine the bias of the morning trading activity, and a way to define risk and reward for a morning trading opportunity.
This information can be updated daily with a Spread Sheet Analysis. A lot of information about the intra-day market can be studied with only the Open, Low, High and Close with the Date as the input. Above you can see the "Smallest Distance from the Open" and "Largest Distance" analysis on this Spread Sheet example. I typically use the 10 Day Average, but the Contract Average can also be used.
The illustratiion above shows how other info such as Daily Range, Open - Close Relationships and Average True Range can be studied.
And as shown above, the Floor Trader Pivots can be easily calculated.
With a little imagination, other relationships can also be studied.
Charles


I have spent much time on Taylor's work too, i use his concepts and jim dalton's reserch on market profile for mkt structure. I can't link doc. files here on combining both. I'll email yu some concepts i've observed... i think with yur back ground yu will find it an interesting read..
ReplyDeletePhenomenal work... i too use the "opening price principle" concept. The SnP opened with in 2.25pts of it's high/low 76% of the time & within the first 30mins of trade.
exceptions were piriods of increased volitility & sept/oct 08 has blown out all numbers.
great work thx for sharing it.....
Jt