Friday, February 29, 2008
ES Market - 02/28/08
Today's session produced a Narrow Range 4 and 7 day (NR4 & NR7) as the market bounced between the Upper Standard Deviation and Lower Standard Deviation of the Nearest Extreme of the Daily Range. The market found support just above 1360, which is also the upper boundary of a support shelf developed over the last 9 trading days. Weak buying interest prevented the market from trading higher than the Standard Deviation resistance.
MARCH OUTLOOK
The third Friday of March is Good Friday, which means that the ES Contract will expire on Thursday, 03/20/08 - Quadruple Witching Day. Contract rollover will occur on Thursday 03/14/08.
The market tends to be bullish the first half of March, and finish weak following expiration. The next FOMC meeting is on Tuesday, 03/18/08, with the announcement at 1415 ET. The market may be anticipating another rate cut, which is currently being priced into the market. However, the recent market enthusiasm maybe short lived.
Charles
Wednesday, February 27, 2008
ES Afternoon Session - 02/27/08
The Equities Market lead the futures in showing weakness via the NYSE Advance - Decline Line. The Indicator traded below the mid-day pivot low, while the futures was still testing the upper limit of the mid-day range. This turned out to be a good shorting opportunity.
For timing, a good place to short in a weak market is when the TICK trades up near the +500 area.
Charles
ES Morning Session - 02/27/08
The morning session demonstrated some interesting Divergences between the ES Futures, TICK and TRIN. As the ES Futures was testing the morning lows, buyers entered the market at the 0930 ET Open at 1374. As the ES Futures traded below a 1000 ET pivot low, the NYSE Advance - Decline Line was making a higher divergence low.
The TRIN indicated some bullish tendency by making lower "closing" highs at the same time. On the same chart, you can see that the ES Futures spent most of the mooring on the bullish side of the 0930 ET Open challenging the Upper Limit of the Nearest Daily Range Extreme Average.
Also notice the formation of a Bullish Gartley Pattern confirmed by the Divergent Indications.
Charles
ES Confirmation Indicators - ADV-DECL, TICK, TRIN
With the ES Futures in a tight trading range during the morning session, the NYSE Advance - Decline Line was showing some bullish tendencies by making higher highs and lows. When the ES Futures traded past the morning high pivot, the Advance - Decline Line confirmed the move, and made higher lows as the ES Futures tested the morning pivot high for support.
Monday, February 25, 2008
Morning Session - ES (02/25/08)
Sunday, February 24, 2008
Statistical Open Range and SpreadSheet Analysis
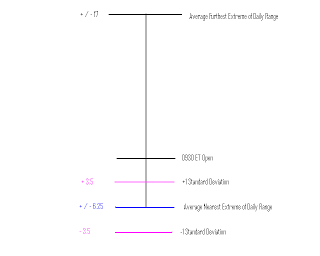
For the ES Futures, 70% of the time, the 0930 ET open is much closer to one of the Daily Range Extremes (High or Low) than the other. Currently, using a 10 day average, the nearest Daily Range Extreme is + or - 6.25 points from the open, with a + or - 3.5 Standard Deviation. The furthest Daily Range Extreme is on average + or - 17 points from the open.
The illustratiion above shows how other info such as Daily Range, Open - Close Relationships and Average True Range can be studied.
And as shown above, the Floor Trader Pivots can be easily calculated.
With a little imagination, other relationships can also be studied.
Friday, February 22, 2008
ES Trending Versus Forming Base
On 02/21/08, the market found resistance at a previous resistance area, and trended down all day. In the top chart above, notice how the NYSE Advance - Decline Line formed lower highs as the ES futures market tested previous pivot lows. A characteristic of a downward trending market.
In contrast, the bottom chart above shows the ES market forming a base in an area of previous support. As the ES market tested pivot lows, the NYSE Advance - Decline Line formed highs lows, indicating that selling pressure was decreasing in the equity market forcing the futures to form a base of support. Not shown on the chart is a rapid uptrend into the close of the market.
In the Base Forming Scenario of the bottom chart, you should consider liquidating short positions.
Charles
Thursday, February 21, 2008
Morning Session - ES (02/21/08)
Cumulative $TICK Indicator
Wednesday, February 20, 2008
Morning Activity - ES (02/20/08)
Once again, the ES market found support neat the 1340 area. The market tested the upper end of the Value Areas formed from 02/07/08 to 02/11/08, and bounced to the upside.
The Statistical Near Extreme Average Range is relative to the 0930 ET open. Currently, it is the open + / - 6.25 ES Points. The yellow lines are the averages plus and minus 1 Standard Deviation.
The ES market did not trade below the - 1 Standard Deviation line, and continuously tested the upper near extreme average. Point of Control was formed at 1342. After forming a series of higher lows, the market broke to the upside.
Another market tell was the fact that the NYSE Advancing Issues - Declining Issues was making higher highs and lows all morning.
Now the markets waits for the FOMC Meeting Minutes at 1400 ET.
Charles
Tuesday, February 19, 2008
ES Market Symmetry
In the chart above, notice the 16 point Initial Wave formed in the morning, followed by a 62% mid-day correction and then concluded with a 16+ point final Impulse Wave in the afternoon. A good example of an almost perfect market symmetry chart. In the morning formation of the Initial Wave, the market demonstrated a short bias by creating a lower pivot low than the pivot low formed overnight.
Above is the final third wave move following the mid-day correction. Again, look for $TICK confirmation.
Saturday, February 16, 2008
Friday (02/15/08) Observations - ES
The Cumulative $TICK Indicator confirmed the afternoon buying spree. Notice the cup and handle formation.
Friday, February 15, 2008
EasyLanguage Code for $TICK Moving Average
Here is the TradeStation Easylanguage Code that produces a $TICK MA (see Top Chart Above) similar to what Brett Steenbarger has in his NYSE TICK post (Second Chart Above):
Inputs: AvgLength ( 5 ), Price ( ( H + L + C ) / 3 );
Vars: Avg ( 0 ) ;
Avg= XAverage ( Price, AvgLength );
Plot1 (Avg, "Average" );
Plot2 ( 0, "ZeroLine" );
Charles
Longer Term View - ES Futures
The top chart is the 60 Minute chart of the ES Futures. We are currently in the middle or Pivot Point/Point of Control of an equilibrium zone between 1400 and 1320. For the last three days, the market has bounced between the 76% and 62% Fibonacci levels of an up leg that started in late January. Short term sees support at 1320 and resistance at 1400. Notice the formation of a short term wedge. Breakout of this wedge may give a clue to larger term market bias.
On the second or daily chart of the S&P 500 Index, the market is below a large resistance zone between 1500 and 1400, which has been created in the last 7 months. It will require something significant for the market to break into that resistant equilibrium zone.
Charles
Funny Fart Mugs
Funny Fart Zone T-shirts
Funny Fart Zone Mugs
Thursday, February 14, 2008
February 14, 2008
Click Here!