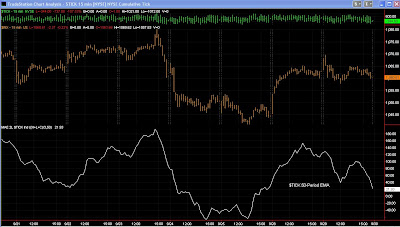
I get emails from time to time asking about this 15-minute $TICK chart. This is how you can duplicate this chart in TradeStation:
- Create a new Chart. Right click on the chart and Format the symbol. In "Settings" change the symbol to "$TICK". In "Settings" also click on "Intra-day" and put "15" in the "Minute Bar" slot. In "Settings" under "Range", put 100 for "Days Back".
- Click on "Style" and choose "OHLC Bar".
- Click on "OK".
- Right click on the chart and click on "Insert Symbol". Type in "$INX" and then "Plot".
- On the Tool Bar, click on "Insert" and then "Indicator". Select "Mov Avg Exponential" and "OK".
- Right click on the chart and click on "Format Analysis Techniques...".
- Click on "Format" for "Mov Avg Exponential".
- Under "General", "1.$TICK 15 min" should be showing in the "Base study on:" slot.
- Click on "Inputs". In the "Price" slot, replace "Close" with "(H+L+C)/3". In the "Length" slot, replace that number with "50".
- Click on "Color". Select white for "AvgExp".
- Click on "Scaling". Change "Same Axis as Underlying Data" with "Right Axis". Change "Sub-graph" to "3".
- Click "OK".
You should have a chart that is the same as the one above.
Charles
No comments:
Post a Comment